


1
2
3
4
5
6

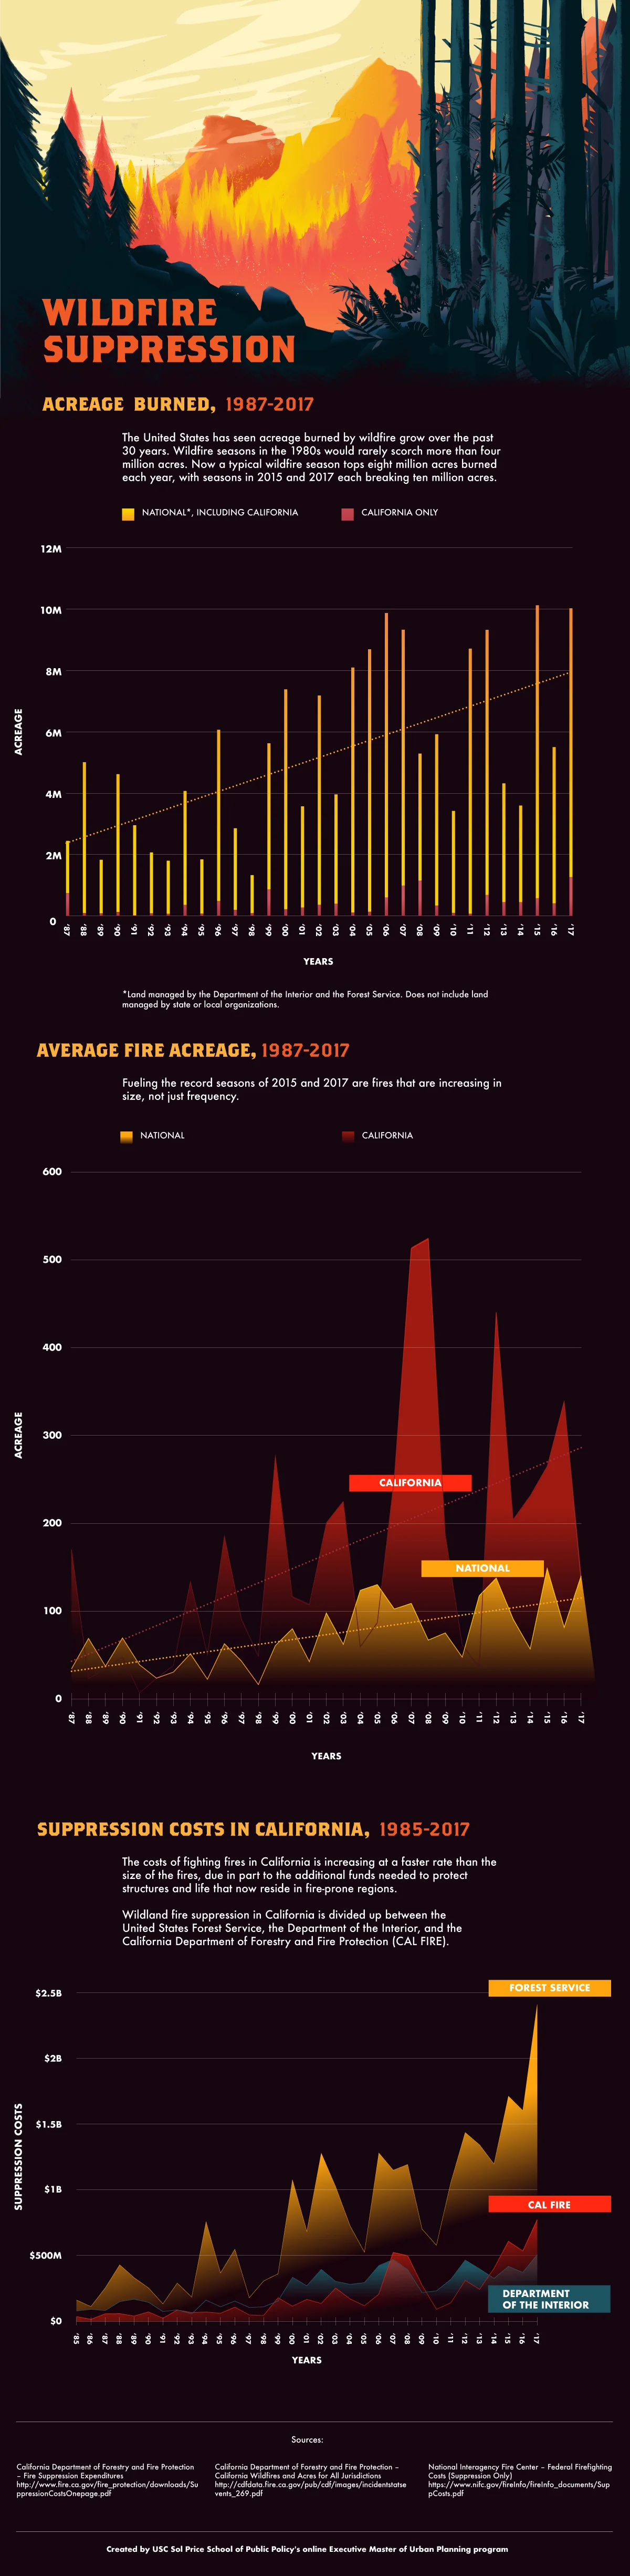
Data visualization on wildfires in the American west, illustrations and layout was created by me. I collaborated with data editor Ryan Abella to best communicate the data. The intention of the visualization was to inform the reading audience (environmentalists, Califorinians, and homebuyers) of the increasing costs of wildfires.